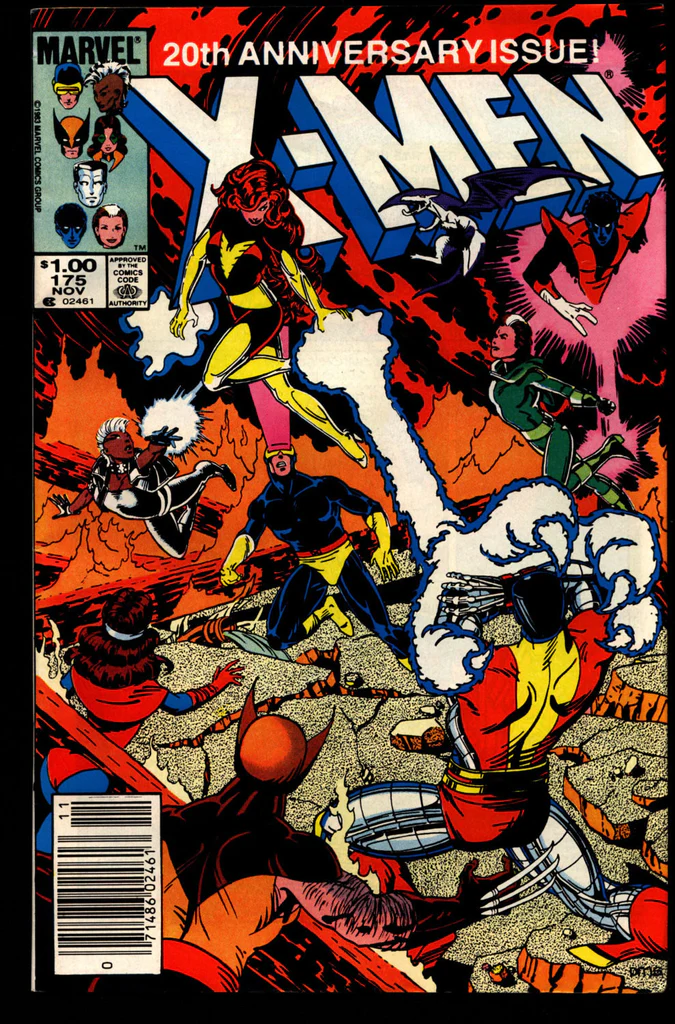
The goal of this project was to graph the connections between different X-men characters in Chris Claremont’s series of Uncanny X-men comics. Relationships between characters were indicated by their appearance on the same comic book cover. I used network analysis to visualize these relationships. Data was culled from issues 150-199 by The Claremont Run Project.
To perform network analysis, two tables are needed, an edge list and a node list. The edge list is comprised of two columns the source and the target and is used to draw links between different nodes (the objects being graphed). The node list assigns a unique ID to every node in the data set. Since the x-man comic cover data set is bipartite (there are two types of nodes), an additional column was added that describes the type of node (issue # or character).

To generate these lists, I used Excel and OpenRefine to format and edit the original data table. To create the bipartite edge list, I needed the data table to be sorted into two columns. Initially using OpenRefine, I deleted all columns except the issue # and Characters Visualized. Next, I separated the Characters Visualized column so that each character was listed in their own row using the Split multi-valued cells function. I then standardized the spelling of each character’s name using the Cluster and Replace functions. Finally, in Excel, I manually edited the Issue # column so that each row without a number was assigned one. To create the node list, the two columns were merged and sorted by name and number. I then used the Blank down function to delete any repeat cells. In Excel, an additional column was added that categorized each node as either an issue or character.
Using the software, Gephi, a bipartite network was created in which edges were drawn between characters that appeared on the same comic cover (characters with the same issue number). The ForceAtlas2 algorithm was used to place nodes with many links at the center of the network. The links between nodes were colored and sized based on the strength of the connection. In other words, characters that shared numerous edges have a single thick dark green edge, while characters who only appeared together once had a slim light green edge.

The characters that appeared together in the highest frequency were Wolverine, Storm, Kitty Pryde, Lockheed the Dragon, Nightcrawler, and Colossus.
One limitation with this approach is that it cannot account for characters known by different aliases. For instance, relationships with Jean Grey are counted separately from Dark Phoenix (another name for the character). I tried to account for aliases when cleaning the data, but it was not always clear whether two incarnations of the same character should be treated distinctly. Additionally, it may not be useful to draw connections between unnamed characters like Imperial guard/command members x5 or Unnamed woman. The presence of these figures on comic book covers may distract from meaningful edges.
To explore the network interactively, please download the .zip file below and open X-man network v3.gephi with the software, Gephi.
